Trace Downstream
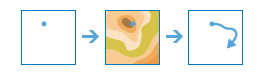
This tool determines the trace, or flow path, in a downstream direction from the points in your input layer.
For example, suppose you have point features representing sources of contamination and you want to determine where in your study area the contamination will flow. You can use Trace Downstream to identify the path the contamination will take. This trace can also be divided into individual line segments by specifying a distance value and units. The line being returned can be the total length of the flow path, a specified maximum trace length, or clipped to area features such as your study area. In many cases, if the total length of the trace path is returned, it will be from the source all the way to the ocean.
The result is a line representing the downstream trace. If a distance is specified for Split the trace into line segments, the trace line will be split into multiple lines where each line is of the specified length. For example, if your input point represents a contamination spill and the river it flows into moves at a rate of 0.6 miles per hour, or 15 miles per day, you might want to split the river into 15 mile segments. Splitting the trace into 15 mile intervals will show approximately where the spill will travel each day. The line will be symbolized using graduated colors based on distance and will be labeled with the distance from the start of the trace.
The resulting trace will have all of the attributes of your input points as well as additional attributes.
- PointID—Contains the ID value from the input point.
- LengthKm—Contains the length in kilometers for the total downstream trace.
- Description and DataResolution—Contains information pertaining to the hydrologic data used to calculate the trace.
- FromDistance and ToDistance—Contains the from and to distance of each line segment. These attributes are written if Split the trace into line segments is used.
If Use current map extent is checked, only the point features in the input layer visible within the current map extent will be analyzed. If unchecked, all features in the input layer will be used, even if they are outside the current map extent.
Point features to use as the starting locations for each downstream trace
The point features to use as the starting location of downstream trace. The output will contain a line for each input point.
In addition to choosing a layer from your map, you can select Choose Living Atlas Analysis Layer or Choose Analysis Layer found at the bottom of the drop-down list. This opens a gallery containing a collection of layers useful for many analyses.
Split the trace into line segments
The trace line will be split into multiple lines where each line is of the specified length. For example, if your input point represents a contamination spill and the river it flows into moves at a rate of 0.6 miles per hour, or 15 miles per day, you might want to split the river into 15 mile segments. Splitting the trace into 15 mile intervals will show approximately where the spill will travel each day. The line will be symbolized using graduated colors based on distance and will be labeled with the distance from the start of the trace. The resulting trace will have multiple line segments, each with fields FromDistance and ToDistance.
Maximum distance of the trace
Determines the total length of the line that will be returned. If you provide area features to clip the trace, the result will be clipped to the area feature, regardless of the distance you enter here.
Clip output to
Either draw or provide a layer of the area where you want the trace to be clipped. For example, if you only want the trace result to be within your study area, such as your county, use your county feature as input so the trace will stop at the county boundary.
Result layer name
This is the name of the layer that will be created in My Content and added to the map. The default name is based on the tool name and the input layer name. If the layer already exists, you will be asked to provide another name.
Using the Save result in drop-down box, you can specify the name of a folder in My Content where the result will be saved.