Summarize Within
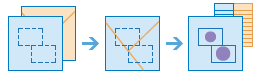
This tool finds features (and portions of features) that are within the boundaries of areas in the first input layer. For example:
- Given a layer of watershed boundaries and a layer of land-use boundaries by land-use type, calculate total acreage of land-use type for each watershed.
- Given a layer of parcels in a county and a layer of city boundaries, summarize the average value of vacant parcels within each city boundary.
If Use current map extent is checked, only those features in the input layer and the layer to be summarized that are visible within the current map extent will be analyzed. If unchecked, all features in both the input layer and the layer to be summarized will be analyzed, even if they are outside the current map extent.
Choose area layer to summarize other features within its boundaries
The area layer that will be used to summarize features that fall within its boundaries.
In addition to choosing a layer from your map, you can select Choose Living Atlas Analysis Layer or Choose Analysis Layer found at the bottom of the drop-down list. This opens a gallery containing a collection of layers useful for many analyses.
Choose layer to summarize
Features in this layer that fall within the boundaries of features in the input layer above will be summarized.
In addition to choosing a layer from your map, you can select Choose Living Atlas Analysis Layer or Choose Analysis Layer found at the bottom of the drop-down list. This opens a gallery containing a collection of layers useful for many analyses.
Add statistics from the layer to summarize
You can optionally calculate statistics for numerical attributes of the points that fall within the boundaries of features.
The Count of points check box, if checked, will calculate the total number of points within each area boundary. In addition, you can calculate statistics for numerical attributes of the points that are within each area boundary.
- Sum—The total value for the specified field.
- Average—The average or mean for the specified field.
- Minimum—The smallest value in the specified field.
- Maximum—The largest value in the specified field.
- Std. Deviation—The standard deviation of the values in the specified field.
Add statistics from
You can optionally calculate statistics for numerical attributes of the lines to be summarized.
The Total length of lines in check box, if checked, will calculate the total length of lines within each area boundary. In addition, you can calculate statistics for numerical attributes of the lines that are within each area boundary.
- Sum—The total value for the specified field.
- Average—The average or mean for the specified field.
- Minimum—The smallest value in the specified field.
- Maximum—The largest value in the specified field.
- Std. Deviation—The standard deviation of the values in the specified field.
Add statistics from
You can optionally calculate statistics for numerical attributes of the areas to be summarized.
The Sum area using check box, if checked, will calculate the total area of features that are within each area boundary of the first input layer. In addition, you can calculate statistics for numerical attributes of the features within each area boundary.
- Sum—The total value for the specified field.
- Average—The average or mean for the specified field.
- Minimum—The smallest value in the specified field.
- Maximum—The largest value in the specified field.
- Std. Deviation—The standard deviation of the values in the specified field.
Add statistics from
Once you choose a layer to summarize, you can optionally calculate statistics of any numerical attributes of the points, lines, or areas within the input area layer.
- Sum—The total value for the specified field
- Average—The average or mean for the specified field
- Minimum—The smallest value in the specified field
- Maximum—The largest value in the specified field
- Std. Deviation—The standard deviation of the values in the specified field
Depending on the types of features you are summarizing, you can calculate total count of nearby points, total length of lines, or total area.
Choose field to group by
This is an attribute of the Summarize features that you can use to calculate statistics separately for each unique attribute value. For example, suppose the first input layer contains city boundaries and the summary features are parcels. One of the attributes of the parcels is Status which contains two values: VACANT and OCCUPIED. To calculate the total area of vacant and occupied parcels within the boundaries of cities, use Status as the group by attribute. The statistics for each group, as well as the count of features within each area boundary, will be displayed in the result layer's pop-up.
Add minority, majority
This checkbox is enabled when you choose a field to group by. If you want to find out which attribute values within each group are the minority (least dominant) or the majority (most dominant) within each boundary of the first input layer, select Add minority, majority. When you select Add minority, majority, two new fields are added to your result layer. If you also select Add percentages, two additional fields are added to the result layer containing the percentages of the minority and majority attribute values within each group.
- If you are summarizing points, minority and majority values are calculated based on the count of points within each bounding area in the input area layer.
- If you are summarizing lines, minority and majority values are calculated based on the length of lines within each bounding area in the input area layer.
- If you are summarizing areas, minority and majority values are calculated based on the areas within each bounding area in the input area layer.
Add percentages
This check box is enabled when you choose a field to group by. Select Add percentages if you want to find the percentage of each attribute value within each group. A new field is added to the result table containing the percentages of each attribute value within each group. If Add minority, majority is also checked, two additional fields are added to the result layer containing the percentages of the minority and majority attribute values within each group.
Result layer name
This is the name of the layer that will be created in My Content and added to the map. The default name is based on the tool name and the input layer name. If the layer already exists, you will be asked to provide another name.
Using the Save result in drop-down box, you can specify the name of a folder in My Content where the result will be saved.