Interpolate Points
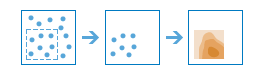
The Interpolate Points tool allows you to predict values at new locations based on measurements from a collection of points. The tool takes point data with values at each point and returns areas classified by predicted values. For example
- An air quality management district has sensors that measure pollution levels. Interpolate Points can be used to predict pollution levels at locations that don't have sensors, such as locations with at-risk populations—schools or hospitals, for example.
- Predict heavy metal concentrations in crops based on samples taken from individual plants.
- Predict soil nutrient levels (nitrogen, phosphorus, potassium, and so on) and other indicators (such as electrical conductivity) in order to study their relationships to crop yield and prescribe precise amounts of fertilizer for each location in the field.
- Meteorological applications include prediction of temperatures, rainfall, and associated variables (such as acid rain).
Choose point layer containing locations with known values
The point layer to use as the basis of interpolation.
In addition to choosing a layer from your map, you can select Choose Living Atlas Analysis Layer or Choose Analysis Layer found at the bottom of the drop-down list. This opens a gallery containing a collection of layers useful for many analyses.
Choose field to interpolate
Choose the field containing the values you wish to interpolate.
Optimize for
Choose your preference for speed versus accuracy. More accurate predictions take longer to calculate.
Output prediction errors
If checked, a layer of standard errors for the interpolation predictions will be created. The name of the output layer will be the result layer name with 'Errors' appended.
Standard errors are useful because they provide information about the reliability of the predicted values. A simple rule of thumb is that the true value will fall within two standard errors of the predicted value 95 percent of the time. For example, suppose a new location gets a predicted value of 50 with a standard error of 5. This means that this tool's best guess is that the true value at that location is 50, but it reasonably could be as low as 40 or as high as 60. To calculate this range of reasonable values, multiply the standard error by 2, add this value to the predicted value to get the upper end of the range, and subtract it from the predicted value to get the lower end of the range.
Classify by
Choose how predicted values will be classified into areas.
- Geometric interval—Areas are based on class intervals that have a geometric series. This method ensures that each class range has approximately the same number of values within each class and that the change between intervals is consistent.
- Equal interval—Areas are created such that the range of predicted values is equal for each area.
- Equal area—Areas are created such that the number of data values in each area is equal. For example, if the data has more large values than small values, more areas will be created for large values.
- Manual—This option allows you to define your own range of values for areas. These values will be entered in the Class break values parameter below.
Number of classes
Specifies the number of classes (range of predicted values) in the result layer. Each class defines the boundary of areas. The values of these classes will be determined by the Classify by parameter above.
Class break values
Enter the desired class break values separated by spaces. For example, if you want class breaks at values of 1.5, 3, and 7, enter 1.5 3 7. These values will define the upper limit of each class, so the number of classes will equal the number of entered values. Areas will not be created for any locations with predicted values above the largest entered break value. You must enter at least two values and no more than 32.
Clip output to
Either draw or provide a layer specifying the area where you want the result to be drawn. For example, if you are interpolating lake pollution measurements, you can use the boundary of the lake in this parameter and the output will only draw within the boundary of the lake.
Predict at these locations
Either draw or provide a layer specifying point locations to calculate prediction values. This allows you to make predictions at specific locations of interest. For example, if the input layer represents measurements of pollution levels, you can use this parameter to predict the pollution levels of locations with large at-risk populations, such as schools or hospitals. You can then use this information to give recommendations to health officials in those locations.
If supplied, this tool will output a point layer of predictions at the specified locations. The name of the output layer will be the result layer name with 'Points' appended.
Result layer name
This is the name of the layer that will be created in My Content and added to the map. The default name is based on the tool name and the input layer name. If the layer already exists, you will be asked to provide another name.
Using the Save result in drop-down box, you can specify the name of a folder in My Content where the result will be saved.