Find Hots Spots
The Find Hot Spots tool will determine if there is any statistically significant clustering in the spatial pattern of your data.
- Are your points (crime incidents, trees, traffic accidents) really clustered? How can you be sure?
- Have you truly discovered a statistically significant hot spot (for spending, infant mortality, consistently high test scores) or would your map tell a different story if you changed the way it was symbolized?
Even random spatial patterns exhibit some degree of clustering. In addition, our eyes and brains naturally try to find patterns even when none exist. Consequently, it can be difficult to know if the patterns in your data are the result of real spatial processes at work or just the result of random chance. This is why researchers and analysts use statistical methods like Find Hot Spots (Getis-Ord Gi*) to quantify spatial patterns. When you do find statistically significant clustering in your data, you have valuable information. Knowing where and when clustering occurs can provide important clues about the processes promoting the patterns you're seeing. Knowing that residential burglaries, for example, are consistently higher in particular neighborhoods is vital information if you need to design effective prevention strategies, allocate scarce police resources, initiate neighborhood watch programs, authorize in-depth criminal investigations, or identify potential suspects.
Choose layer for which hot spots will be calculated
The point from which hot and cold spots will be found.
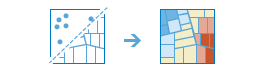
Find clusters of high and low
This analysis answers the question: Where do high and low values cluster spatially?
If your data is points and you choose Point Counts, this tool will evaluate the spatial arrangement of the point features to answer the question: Where are points unexpectedly clustered or spread out?
Select the bin size for hots pot calculations
The distance used to generate bins to analyze your input points.
Aggregate using time slices (optional)
If time is enabled on the input point layer and it is of type instant, then you can analyze using time slicing. There are three parameters you can set when you use time:
- Time Interval
- Time Step
- Reference Time
Imagine you had data that represented a year in time, and you wanted to analyze using weekly slices. To do that you would set you Time Interval to 1 week.
Imagine you had data that represented a year in time, and you wanted to analyze using the first week of month. To do that you would set you Time Interval to 1 week, your Time Step to 1 month, and your Reference Time to January 1, at 12:00 am.
Time interval to be aggregate into
Interval of time used for slicing the data. Time interval may be used alone, or used with the Time Step or Reference Time.
If you wanted to create time slices that took place every Monday from 9:00 am until 10:00 am. The Time Interval would be one week. The Time Step would be one week, and the Reference Time would be 9:00:00 AM on a Monday.
Time step to be aggregate into
The step used for calculating a time slice. Time step may be used alone, with a Time Interval, with a Reference Time, or with both a Time Interval and Reference Time.
If you wanted to create time slices that took place every Monday from 9:00 am until 10:00 am. The Time Interval would be one week. The Time Step would be one week, and the Reference Time would be 9:00:00 AM on a Monday.
Reference time used to align the time slicing
The date and time used to align time slicing. Time Steps will start from, and continue backwards for the reference time.
If you wanted to create time slices that took place every Monday from 9:00 am until 10:00 am. The Time Interval would be one week. The Time Step would be one week, and the Reference Time would be 9:00:00 AM on a Monday.
Select the neighborhood size
The distance used to determine the neighborhood used for hot spot calculations. The neighborhood should be larger than the bin size to ensure that each bin has at least one neighbour. Each bin is analyzed and compared to the neighboring bins.
SpatialReference (wkid)
This is a temporary parameter for Pre-Release to set the processing spatial reference. Many big data tools require that a projected coordinate system is used as the spatial reference for processing. By default, the tool will use the input coordinate system, but will fail if it's a geographic coordinate system. To set a projected coordinate system, enter the WKID. For example, Web Mercator would be entered as 3857.
Choose datastore
This is a temporary parameter for the Pre-Release to set the data store that results are saved to. Both data stores are part of ArcGIS Data Store. If you select the spatiotemporal data store, and do not have one installed the tool will fail.
Result layer name
This is the name of the layer that will be created in My Content and added to the map. The default name is based on the tool name and the input layer name. If the layer already exists the tool run will fail.
This result layer will show you statistically significant clusters of high and low values or point counts. If the result layer name already exists you will be asked to rename it.
Using the Save result in drop-down box, you can specify the name of a folder in My Content where the result will be saved.