Calculate Density
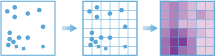
The Calculate Density tool creates a density map from point features by spreading known quantities of some phenomenon (represented as attributes of the points) across the map. The result is a layer of areas classified from least dense to most dense.
For point input, each point should represent the location of some event or incident, and the result layer represents a count of the incident per unit area. A higher density value in a new location means that there are more points near that location. In many cases, the result layer can be interpreted as a risk surface for future events. For example, if the input points represent locations of lightning strikes, the result layer can be interpreted as a risk surface for future lightning strikes.
Other use cases of this tool include the following:
- Creating crime density maps to help police departments properly allocate resources to high crime areas.
- Calculating densities of hospitals within a county. The result layer will show areas with high and low accessibility to hospitals, and this information can be used to decide where new hospitals should be built.
- Identifying areas that are at high risk of forest fires based on historical locations of forest fires.
- Locating communities that are far from major highways in order to plan where new roads should be constructed.
Choose input points to calculate density on
The point layer that the density will be calculated on.
In addition to choosing a layer from your map, you can select Browse Layers found at the bottom of the drop-down list to browse your contents for a big data file share dataset or feature layer.
Choose a field(s) to calculate density on
Provide a field(s) specifying the number of incidents at each location. For example, if you have points that represent cities, you can use a field representing the population of the city as the count field, and the resulting population density layer will calculate larger population densities near cities with larger populations.
The density for the count of points will always be calculated. If no fields are selected, each location will be assumed to represent a single count.
Choose a bin type
The type of bins that points are aggregated into and used for the density calculation.
Select the bin size for density calculations
The size of the bins generated. For a square bin, the size represents the height of the square. For hexagon, the size represents the height of the hexagon (with parallel side).
Select the density weighting to apply
The type of weighting applied to the density calculation. There are two options:
- Uniform—this calculates a magnitude-per-area.
- Kernel—applies a kernel function to fit a smooth tapered surface to each point.
Select the neighborhood size
The size of the area that is used to calculate the density. The neighborhood size must be larger than the bin size.
Choose the output units for density
The desired output units of the density values. By default this is set to the units in your map (for example, square meters). If density values are very small, you can increase the size of the area units (i.e., square meters to square kilometers) to return larger values. This values only scales the result.
Calculate density using time slices (optional)
If time is enabled on the input point layer and it is of type instant, then you can analyze using time slicing. There are three parameters you can set when you use time:
- Time Interval
- Time Step
- Reference Time
Imagine you had data that represented a year in time, and you wanted to analyze using weekly slices. To do that you would set you Time Interval to 1 week.
Imagine you had data that represented a year in time, and you wanted to analyze using the first week of month. To do that you would set you Time Interval to 1 week, your Time Step to 1 month, and your Reference Time to January 1, at 12:00 am.
Time interval to calculate density on
Interval of time used for slicing the data. Time interval may be used alone, or used with the Time Step or Reference Time.
If you wanted to create time slices that took place every Monday from 9:00 am until 10:00 am. The Time Interval would be one week. The Time Step would be one week, and the Reference Time would be 9:00:00 AM on a Monday.
Time step to calculate density on
The step used for calculating a time slice. Time step may be used alone, with a Time Interval, with a Reference Time, or with both a Time Interval and Reference Time.
If you wanted to create time slices that took place every Monday from 9:00 am until 10:00 am. The Time Interval would be one week. The Time Step would be one week, and the Reference Time would be 9:00:00 AM on a Monday.
Reference time used to align the time slicing
The date and time used to align time slicing. Time Steps will start from, and continue backwards for the reference time.
If you wanted to create time slices that took place every Monday from 9:00 am until 10:00 am. The Time Interval would be one week. The Time Step would be one week, and the Reference Time would be 9:00:00 AM on a Monday.
SpatialReference (wkid)
This is a temporary parameter for Pre-Release to set the processing spatial reference. Many big data tools require that a projected coordinate system is used as the spatial reference for processing. By default, the tool will use the input coordinate system, but will fail if it's a geographic coordinate system. To set a projected coordinate system, enter the WKID. For example, Web Mercator would be entered as 3857.
Choose datastore
This is a temporary parameter for the Pre-Release to set the data store that results are saved to. Both data stores are part of ArcGIS Data Store. If you select the spatiotemporal data store, and do not have one installed the tool will fail.
Result layer name
This is the name of the layer that will be created in My Content and added to the map. The default name is based on the tool name and the input layer name. If the layer already exists the tool run will fail.
Using the Save result in drop-down box, you can specify the name of a folder in My Content where the result will be saved.