Calculate Density
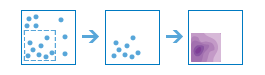
The Calculate Density tool creates a density map from point or line features by spreading known quantities of some phenomenon (represented as attributes of the points or lines) across the map. The result is a layer of areas classified from least dense to most dense.
For point input, each point should represent the location of some event or incident, and the result layer represents a count of the incident per unit area. A higher density value in a new location means that there are more points near that location. In many cases, the result layer can be interpreted as a risk surface for future events. For example, if the input points represent locations of lightning strikes, the result layer can be interpreted as a risk surface for future lightning strikes.
For line input, the line density surface represents the total amount of line that is near each location. The units of the calculated density values are the length of line per unit area. For example, if the lines represent rivers, the result layer will represent the total length of rivers that are within the search radius. This result can be used to identify areas that are hospitable to grazing animals.
Other use cases of this tool include the following:
- Creating crime density maps to help police departments properly allocate resources to high crime areas.
- Calculating densities of hospitals within a county. The result layer will show areas with high and low accessibility to hospitals, and this information can be used to decide where new hospitals should be built.
- Identifying areas that are at high risk of forest fires based on historical locations of forest fires.
- Locating communities that are far from major highways in order to plan where new roads should be constructed.
Choose point or line layer from which to calculate density
The point or line layer from which density will be calculated.
In addition to choosing a layer from your map, you can select Choose Living Atlas Analysis Layer or Choose Analysis Layer found at the bottom of the drop-down list. This opens a gallery containing a collection of layers useful for many analyses.
Use a count field
Provide a field specifying the number of incidents at each location. For example, if you have points that represent cities, you can use a field representing the population of the city as the count field, and the resulting population density layer will calculate larger population densities near cities with larger populations.
If the default choice of None is used, each location will be assumed to represent a single count.
Search Distance
Enter a distance specifying how far to search to find point or line features when calculating density values. For example, if you provide a search distance of 10,000 meters, the density of any location in the output layer is calculated based on features that are within 10,000 meters of the location. Any location that does not have any incidents within 10,000 meters will receive a density value of zero.
If no distance is provided, a default will be calculated that is based on the locations of the input features and the values in the count field (if a count field is provided).
Clip output to
Either draw or provide a layer specifying the area where you want densities to be calculated. For example, if you are calculating densities of fish within a lake, you can use the boundary of the lake in this parameter and the output will only draw within the boundary of the lake.
Classify by
Choose how density values will be classified into areas.
- Equal interval—Areas are created such that the range of density values is equal for each area.
- Geometrical interval—Areas are based on class intervals that have a geometrical series. This method ensures that each class range has approximately the same number of values within each class and that the change between intervals is consistent.
- Natural breaks—Class intervals for areas are based on natural groupings of the data. Class break values are identified that best group similar values and that maximize the differences between classes.
- Equal area—Areas are created such that the size of each area is equal. For example, if the result layer has more high density values than low density values, more areas will be created for high densities.
- Standard deviation—Areas are created based upon the standard deviation of the predicted density values.
Number of classes
Specifies the number of classes (range of predicted values) in the result layer. Each class defines the boundary of areas. The values of these classes will be determined by the Classify by parameter above.
Output area units
Specify the output area unit. Density is count divided by area, and this parameter specifies the unit of the area in the density calculation.
Result layer name
This is the name of the layer that will be created in My Content and added to the map. The default name is based on the tool name and the input layer name. If the layer already exists, you will be asked to provide another name.
Using the Save result in drop-down box, you can specify the name of a folder in My Content where the result will be saved.