Aggregate Points
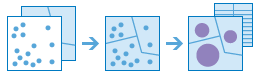
This tool works with a layer of point features and a layer of area features. It first determines which points fall within each area. After determining this point-in-area spatial relationship, statistics about all points in the area are calculated and assigned to the area. The most basic statistic is the count of the number of points within the area, but you can get other statistics as well.
For example, suppose you have point features of coffee shop locations and area features of counties, and you want to summarize coffee sales by county. Assuming the coffee shops have a TOTAL_SALES attribute, you can get the sum of all TOTAL_SALES within each county, or the minimum or maximum TOTAL_SALES within each county, or the standard deviation of all sales within each county.
If Use current map extent is checked, only the features in the input point layer and area layer visible within the current map extent will be analyzed. If unchecked, all features in both the input point layer and the area layer will be analyzed, even if they are outside the current map extent.
Choose layer containing points to aggregate into areas
The point layer that will be aggregated into the areas.
In addition to choosing a layer from your map, you can select Choose Living Atlas Analysis Layer or Choose Analysis Layer found at the bottom of the drop-down list. This opens a gallery containing a collection of layers useful for many analyses.
Choose layer containing aggregation areas
The area layer to which the points will be aggregated. Any points that fall within the boundaries of areas in this layer will be counted and optionally summarized using your choices of statistics.
In addition to choosing a layer from your map, you can select Choose Living Atlas Analysis Layer or Choose Analysis Layer found at the bottom of the drop-down list. This opens a gallery containing a collection of layers useful for many analyses.
Keep areas with no points
Determines whether areas that have no points within them appear in the result layer. If unchecked, areas without points will not appear in the result. If checked, areas without points will appear in the result.
Add statistic
You can calculate statistics about attributes of the input point layer such as sum, mean, minimum, maximum, and standard deviation. The result layer will contain a new attribute for each statistic calculated. Any number of statistics can be added by choosing an attribute and statistic (a new drop-down box will appear).
Choose field to group by
You can create statistical groups using an attribute in the input point layer. For example, if you are aggregating crimes to neighborhood boundaries, you may have an attribute Crime_type with five different crime types. Each unique crime type forms a group, and the statistics you choose will be calculated for each unique value of Crime_type. The statistics for each group, as well as the count of points, will be displayed in the result layer's pop-up. When you choose a grouping attribute, two results are created: the result layer and a result table containing the statistics for each unique group.
Add minority, majority
This checkbox is enabled when you choose a field to group by. If you want to find out which attribute values within each group are the minority (least dominant) or the majority (most dominant) within each boundary, select Add minority, majority. When you select Add minority, majority, two new fields are added to your result layer. If you also select Add percentages, two additional fields are added to the result layer containing the percentages of the minority and majority attribute values within each group.
For example, if you are a city planner and you want to find out which tree species are in the minority and which are in the majority within all city parks, aggregate your tree data with your park areas and check this option.
Add percentages
This check box is enabled when you choose a field to group by. Select Add percentages if you want to find the percentage of each attribute value within each group. A new field is added to the result table containing the percentages of each attribute value within each group. If Add minority, majority is also checked, two additional fields are added to the result layer containing the percentages of the minority and majority attribute values within each group.
Result layer name
This is the name of the layer that will be created in My Content and added to the map. The default name is based on the tool name and the input layer name. If the layer already exists, you will be asked to provide another name.
Using the Save result in drop-down box, you can specify the name of a folder in My Content where the result will be saved.